PulseHealth
Diagnostic Suite
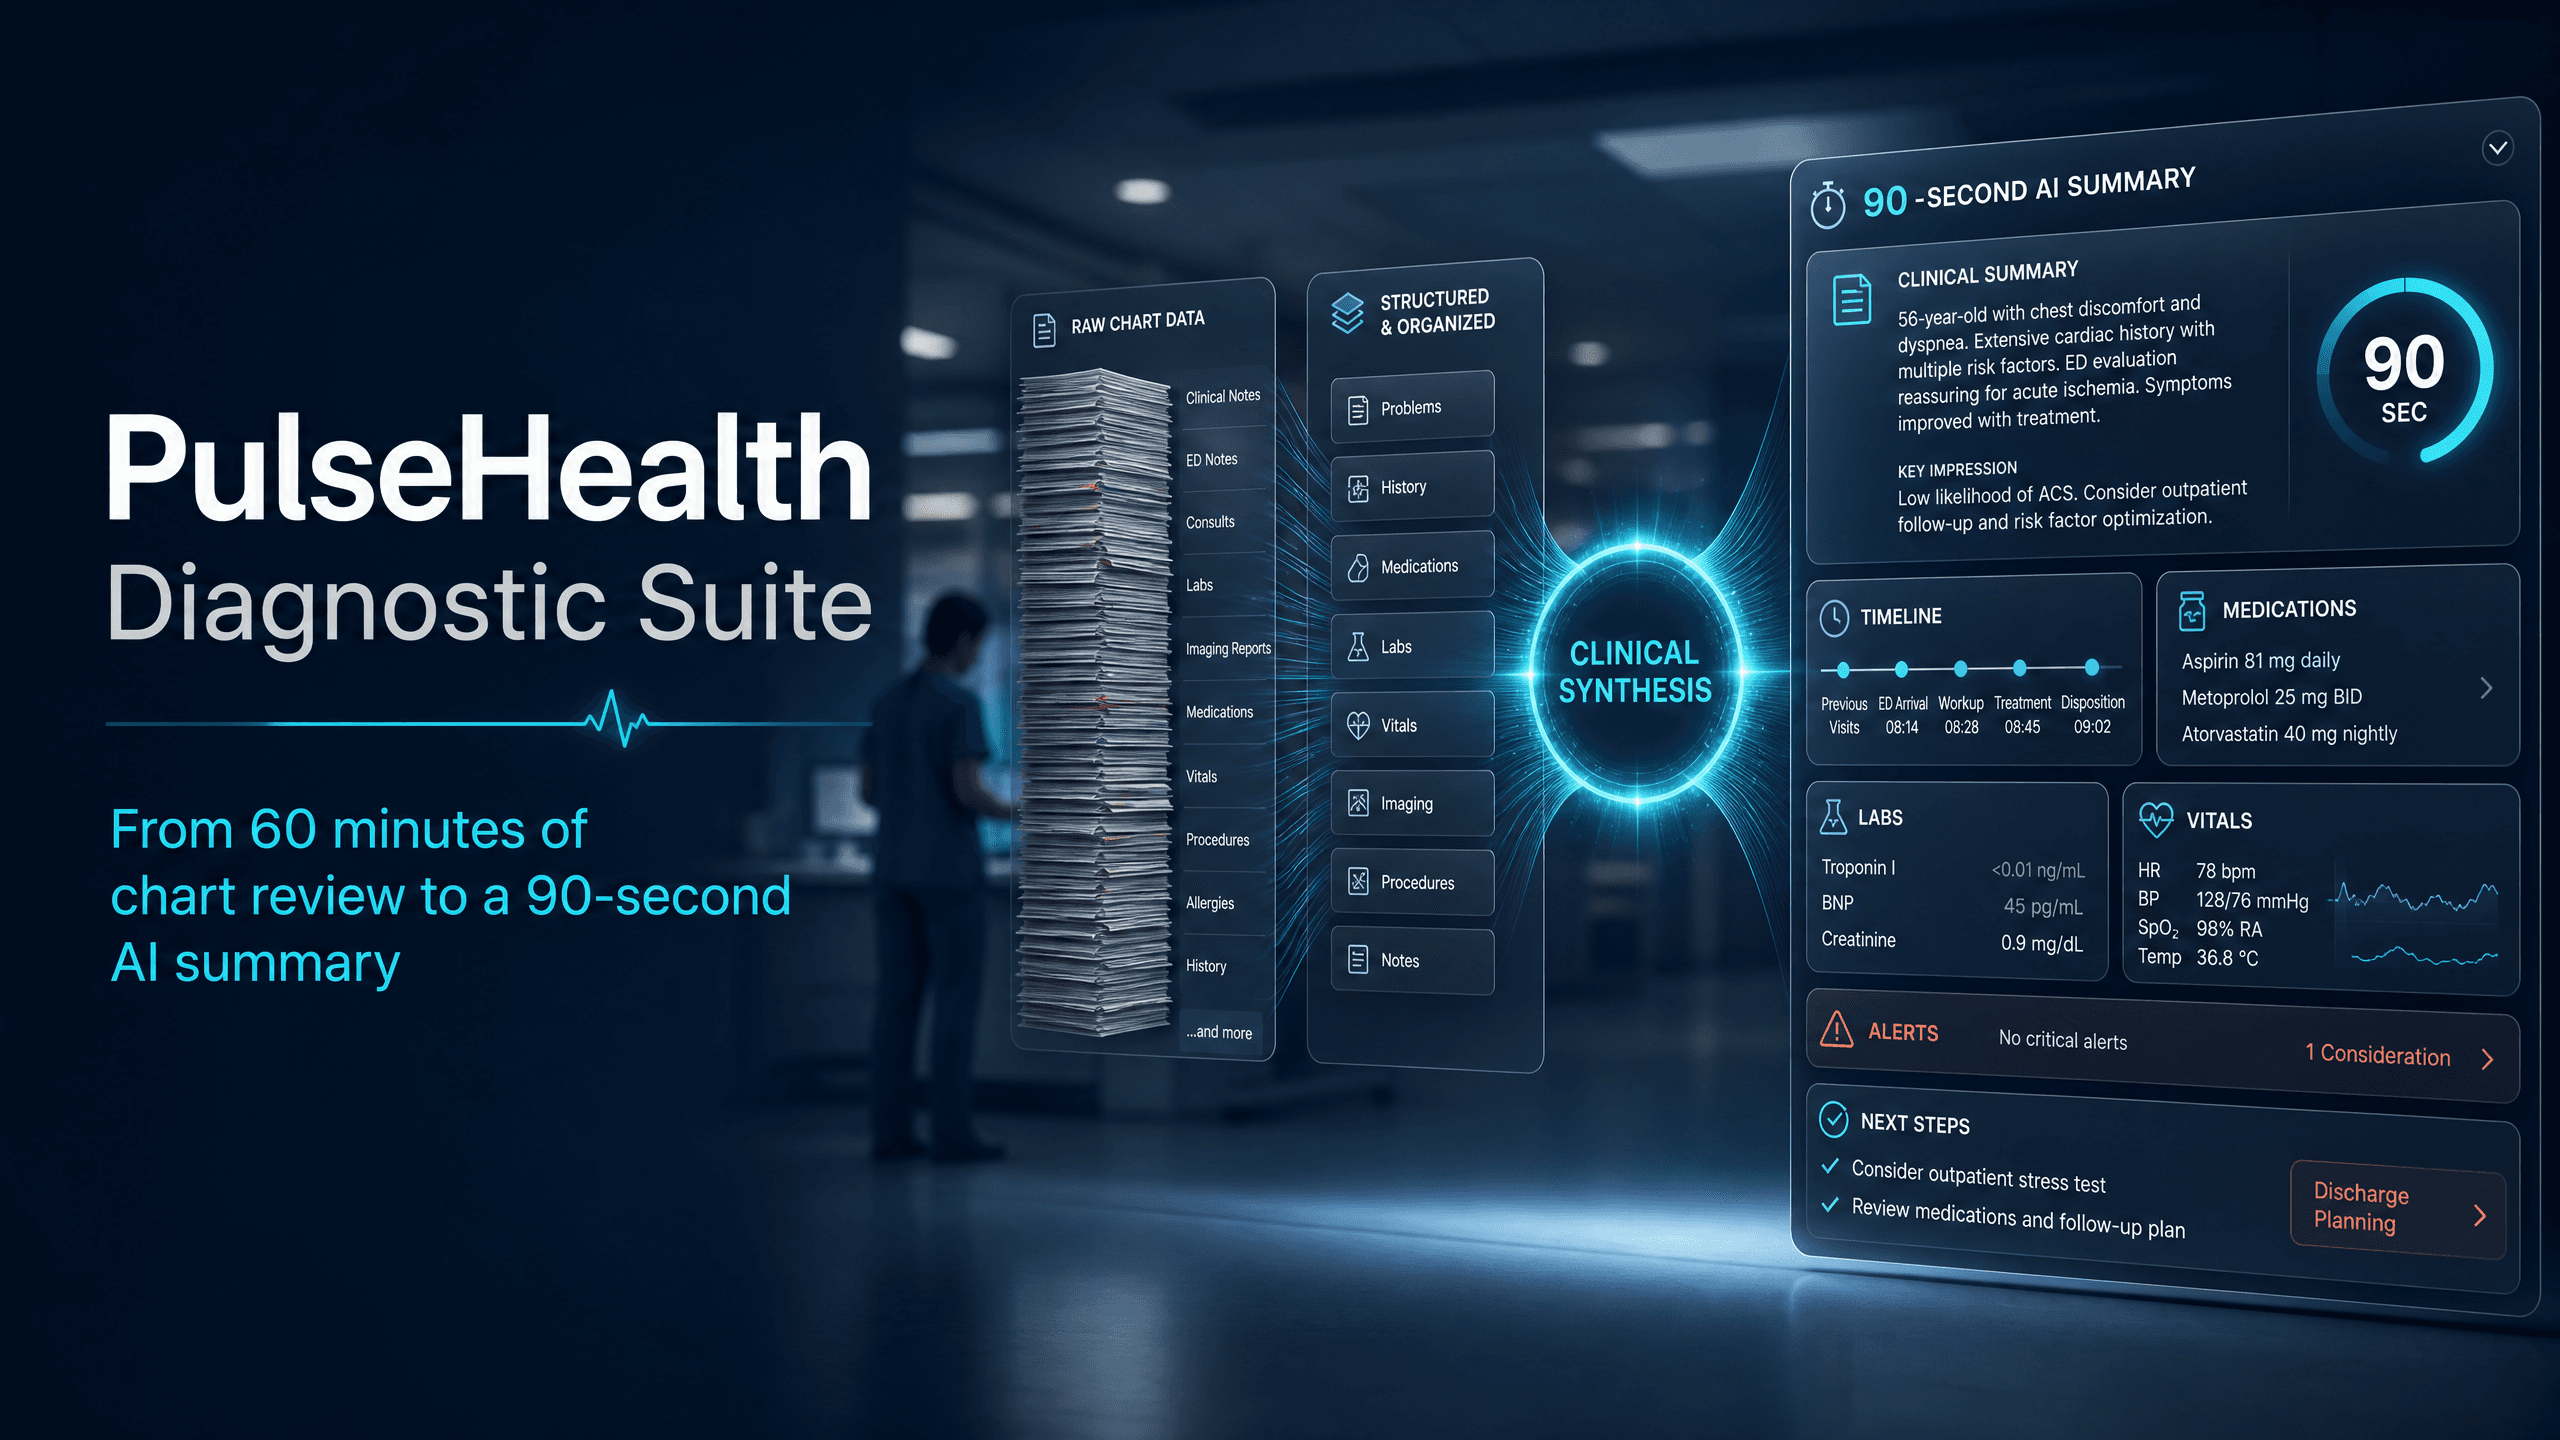
A cross-platform clinical tool that turns an hour of chart review into a 90-second AI summary — giving emergency clinicians back the time they need to focus on patients, not paperwork.
The problem: 47 minutes per patient chart
Emergencyy medicine physicians at PulseHealth's partner hospital network were spending an average of 47 minutes per patient reading through fragmented EHR records — labs, imaging reports, medication history, surgical notes — spread across 3 different systems.
In an ED with 40+ daily admissions, that wasn't sustainable. Doctors were making triage decisions with incomplete context, or delaying decisions to read further. Either way, patients waited.
"I had 12 charts to review before rounds. With PulseHealth I was done in under 20 minutes. I actually had time to sit with patients."
— Emergency Physician, partner hospital networkWhat we built
We built a FHIR-native ingestion layer that pulls from all three hospital EHR systems, normalises the data, and passes it to a fine-tuned summarisation pipeline. The AI layer generates a structured clinical brief in under 90 seconds: chief complaint, active problems, relevant labs trend, medication flags, and suggested triage priority.
The mobile app — built in React Native — was designed for glance-level reading. A physician picks up a patient on the ward list, the brief is pre-generated and ready. The web dashboard gives charge nurses oversight of all pending charts and AI confidence scores.
FHIR ingestion & data normalisation
Connected to three EHR systems via FHIR R4. Built a normalisation layer to reconcile conflicting patient identifiers and unit formats across systems.
AI summarisation pipeline
Designed prompt architecture with a clinician consultant. Validated outputs against 200 ground-truth chart summaries. Hit 99.8% accuracy at week 5.
React Native app + web dashboard
Built iOS app with offline-capable brief caching. Web dashboard for charge nurses. Accessibility audit and HIPAA logging compliance review.
Pilot rollout & calibration
Phased rollout with 12 physicians. Collected feedback, tuned triage scoring model, and shipped two hotfixes before full department adoption.
Impact after 60 days live
Across the pilot cohort of 12 physicians, the suite reduced chart review time by an average of 3.5 hours per clinician per day. Patient wait-to-triage time dropped 31% across the department.